Beyond Hires per Recruiter: A smarter way to measure recruiting performance
In today’s dynamic hiring environment, the traditional hires-per-recruiter metric falls short of capturing the full picture. By adopting Hiring Points and tracking Spend per Hiring Point, recruiting leaders can move beyond outdated vanity metrics and focus on true team performance and efficiency.


Summary: The traditional metric of hires per recruiter is an outdated vanity metric that doesn’t tell the full story of a recruiters productivity, performance, or effectiveness. Additionally, when we are looking at the performance of the entire Recruiting function, we need to include the whole team in our metrics.
I will layout a framework useful for Recruiting leaders to assess the health of their team. We'll start with an individual recruiter performance metric, then the team, and ultimately we have to include a spend dimension.
Recruiter Performance
The traditional model of measuring recruiter productivity by hires per recruiter is a simplistic and outdated approach that fails to capture the complexity and nuance of recruiting. This metric overlooks critical factors such as the difficulty of making the hire and the quality of hire leading to inaccurate and incomplete assessments of recruiter performance.
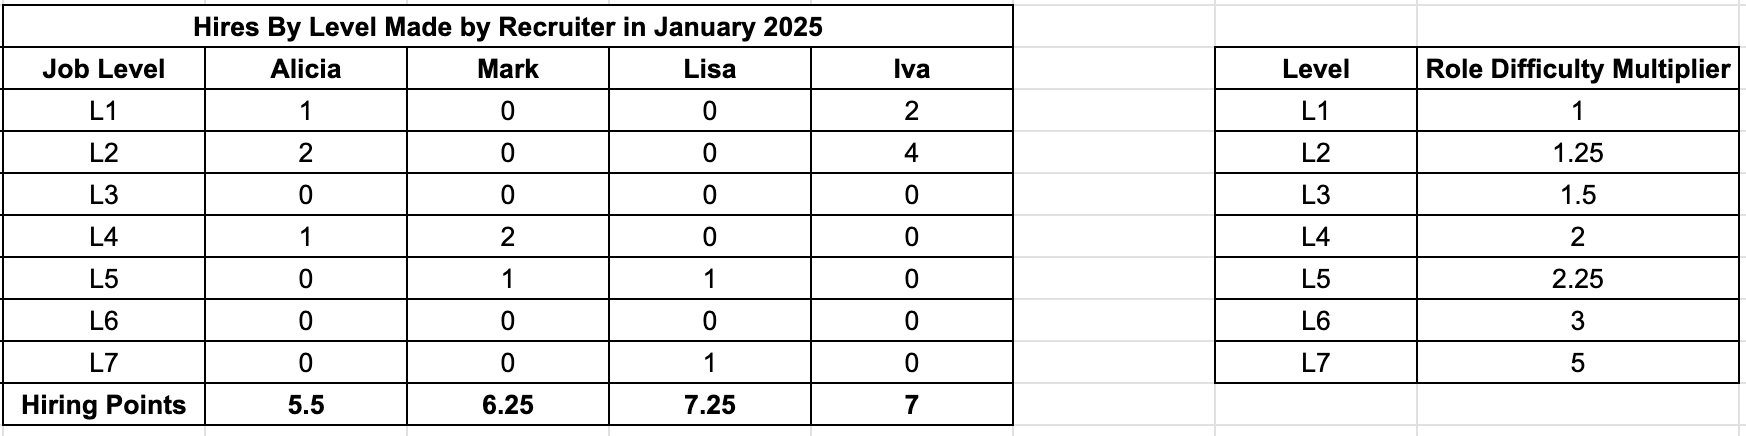
Here is a simple model that assigns a point value to each hire based on its corresponding level within the organization. This allows differentiation across hiring an L1, L3, and so on.
How to calculate your hiring points:
Calculating your Hiring Points is as simple as counting the number of hires made for each job level and multiplying it by the role difficulty multiplier. You can customize this multiplier based on your unique company circumstances and even create an entire framework based on multiple components of each role. This might include:
- hiring repeatability (evergreen vs unique hiring needs)
- talent availability and market demand
- offer attractiveness
- role level
- geographic restrictions
You can always back test your proposed difficulty multiplier by changing the numbers and comparing it to previous timeframes to see what works for your company.
Before we jump into the team view, it is important to understand the hiring environment you have been and will be in moving forward. Hyper growth environments tend to create high volume hiring opportunities.
What is the hiring environment?
Hiring in 2022 was much different than hiring in 2025. Zero interest rate policies created an environment where recruiters were the most in-demand profession as companies looked to grow revenue by hiring people.
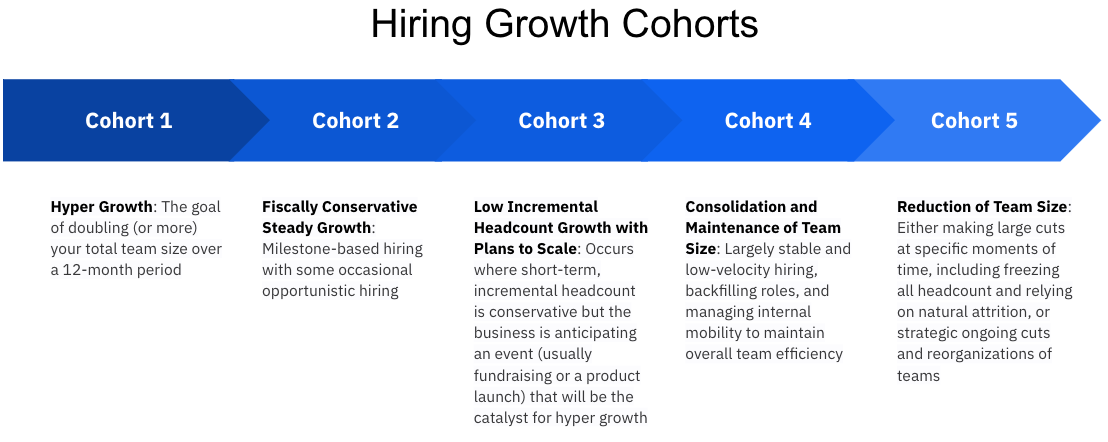
Jim Miller lays out five different types of hiring in his hiring excellence framework. Cohort 1 is hyper growth and to the other end of the spectrum Cohort 5 is a reduction of employee size. Understanding your environment will help you understand what you can expect in your hiring points metrics.
Now that we've established the concept of hiring points and revisited hiring growth cohorts, let's turn towards the team.
Recruiting Team Performance
When we evaluate the effectiveness of the entire Recruiting organization, hires by recruiter neglects to account for the supporting roles that enable recruiters to succeed, such as managers, sourcers, and the operations team.
By looking at the entire hiring points achieved we'll have clear metrics on how the team is performing over time.
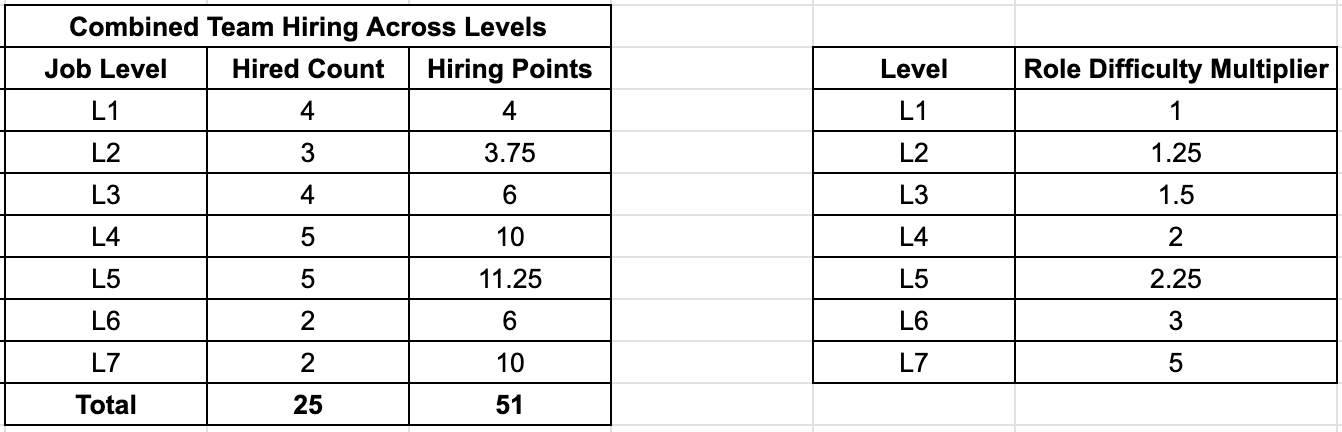
We'll sum all hiring points and then divide this total by the total headcount of the recruiting organization, including all supporting roles and every single manager. This approach provides a more comprehensive and accurate measure of Recruiting productivity, recognizing that the entire team, systems, and processes contributes to the hiring process.
The next chart is an example that shows how the average hiring points per talent acquisition team member can be useful context for the appropriate team size. You ideally want to see efficiency gains translating in the team being able to increase the number of points per team member across time.
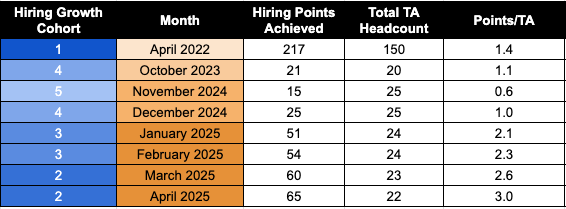
Just as company leaders evaluate revenue per employee, hiring points per recruiting team member can help the Head of Talent continue to evaluate and make decisions that are best for the company.
By using this point-based system and accounting for the total headcount of the recruiting organization, we can gain a more nuanced understanding of our team's performance and efficiency. This approach allows us to assess the productivity of our entire recruiting function, rather than just individual recruiters. By considering the contributions of all team members, we can also recognize and reward the hard work and dedication of our support staff, who play a critical role in enabling our recruiters to succeed. By moving beyond the simplistic hires per recruiter metric, we can drive more informed decision-making, improve team performance, and ultimately deliver better business outcomes.
It may be best to look at this across multiple time frames(month, quarter, half) and understand the trends before adjusting your approach or taking irrevocable action.
That's not all
If we want to expand this approach of continued efficiency along the lines of revenue per employee, we should look at our spend per hiring point across time.
This is not a post debating whether we should or shouldn't measure cost per hire. For many reasons, I believe this metric is not useful and nearly impossible to benchmark properly.
Spend per Hiring Point
Another way to look at the efficiency of our Recruiting team is by looking at the spend per hiring point. The majority of our spend is in salary costs. We also have tooling and infrastructure costs, and variable costs such as background checks, referral payments, and search fees.
Spend per hiring point is calculated by adding up all of your Recruiting department expenses and dividing it by your total number of hiring points.

This is one of the most important components of how you can evaluate the efficiency of the recruiting team. When you evaluate every decision, you can evaluate it against how it will impact your spend per hiring point.
Should we bring in this tool? Should we renew this tool? Do we need to add someone to our team? Where can we reduce spend that won't impact our ability to reduce our spend per hiring point?
Warning
⚠️ Everything beyond this goes much beyond what you'd need to know to begin implementing these metrics to drive efficiency with your team. ⚠️
Without getting too much into one of my favorite topics, fiat money, I'll need to briefly highlight how to have better spend comparisons across time.
Below is the M2 ten year chart from the Fed. What this shows is the number of US Dollars in M2 has increased from less than $12 trillion to over $21.5 trillion in the last ten years, an 80% increase! 🤯 If you don't think this impacts everything, including your spend per hire benchmarks, we should talk.
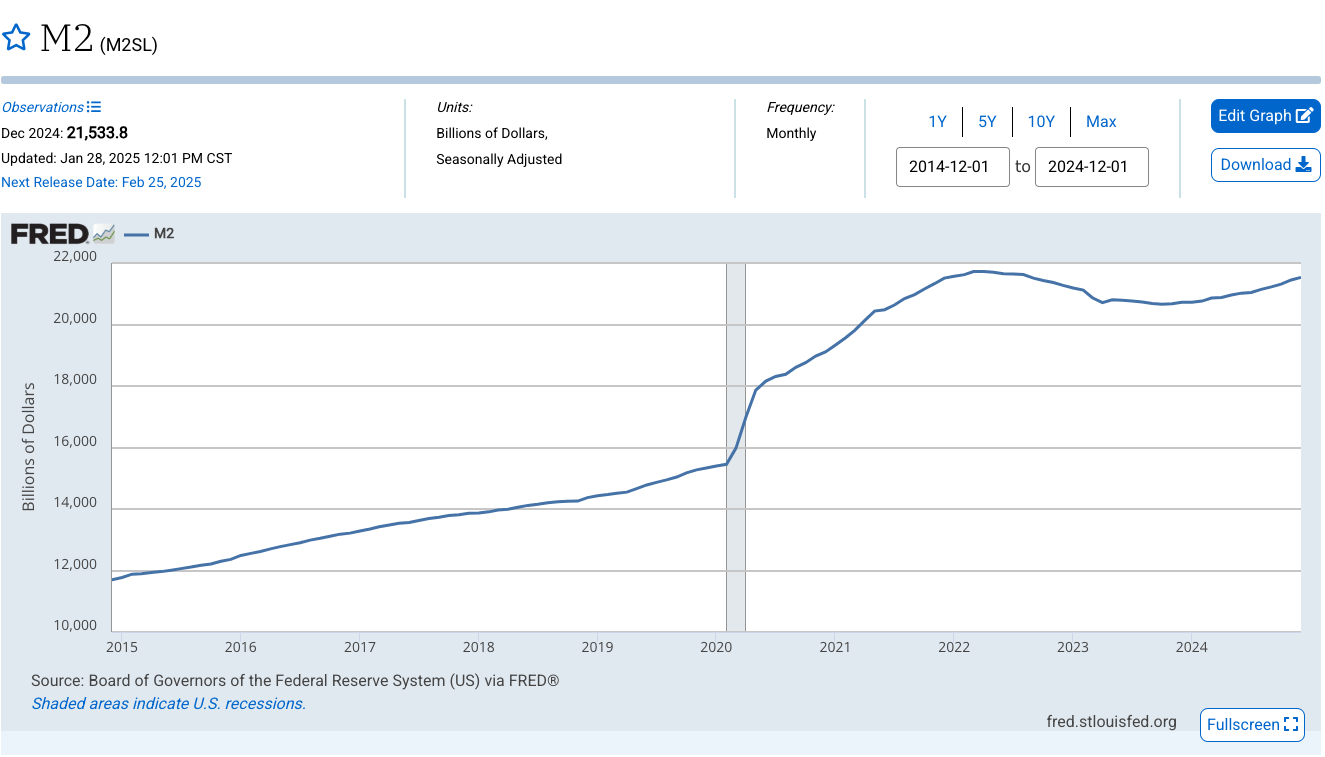
As you can see, comparing your spend year over year, especially comparing anything prior to 2020 to after doesn't tell the complete story. The main unit of account you are measuring is US Dollars($) and 1$ ≠ $1 across the dimension of time.
I have a formula that helps us compare our spend and efficiency across time. We add up all costs in the entire Recruiting department and divide it by our hiring points to get a spend per hiring point number.
As I discussed above, we'll also need a way to compare this across time and so we need to understand the impact of M2 at the time of spend. $1 of spend in 2015 now equates to $1.80 in 2025.
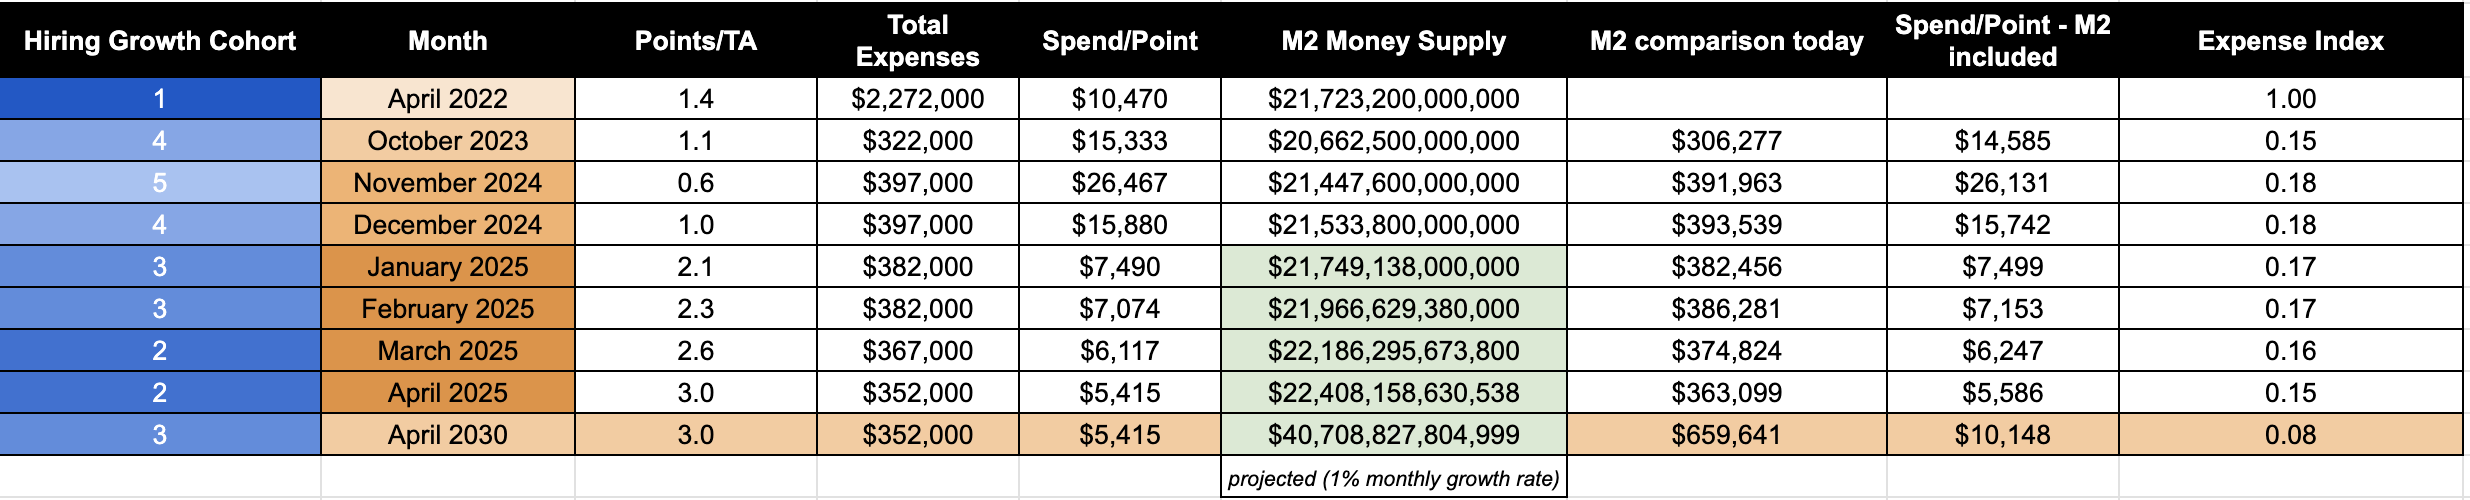
As you can see, by beginning to track our spend/point metric now, we will be able to compare how our spend changes over many years if we keep it in relation to a constant measurement. The last line above shows the impact of an M2 increase of 1% each month over the next five years.
Based on M2 increasing, we could expect a $10,100 per hiring point figure in 2030 compared to today's $5,400 per hiring point. (This is if we hire the same number of hiring points with the same team size and the exact same costs.)

....
Expense Index 🤓
I created a quick formula to track how our expenses are growing compared to M2. I'm calling it the Expense Index.

This Expense Index is a ratio that compares the growth of expenses to the growth of M2 over time. If the Expense Index is over 1.00, your costs are rising faster than the money supply.
How to interpret your expense index:
- 0.00 – 0.50: Exceptional control. Expenses are growing much slower than M2.
- 0.51 – 0.99: Efficient. Expenses are growing slower than M2.
- 1.00: Neutral. Expenses are growing at the same rate as M2.
- 1.01+: Slightly concerning. Expenses are growing faster than M2.
A Smarter Path to Recruiting Excellence
In today’s dynamic hiring environment, the traditional hires-per-recruiter metric falls short of capturing the full picture. By adopting Hiring Points and tracking Spend per Hiring Point, recruiting leaders can move beyond outdated vanity metrics and focus on true team performance and efficiency.
The addition of the Expense Index provides a broader economic perspective, ensuring that your recruiting spend is evaluated in context—not just by internal benchmarks but also by the economic reality of the time. This insight empowers recruiting teams to make better decisions about tools, headcount, and resource allocation.
What Should You Do Next?
- ✅ Start tracking Hiring Points for individual recruiters and your entire team.
- ✅ Calculate Spend per Hiring Point to monitor how your efficiency evolves over time.
- ✅ Use the Expense Index to assess how your costs compare to external economic factors.
By taking these steps, recruiting leaders can build a more accurate, data-driven foundation for evaluating and improving performance, ultimately driving better business outcomes. 🚀
In a future post, I'll introduce the concept of Recruiting Activity Points and how this can be useful as an efficiency benchmark and individual coaching.
Up only!